
TOTAL DEPOSITS (` IN CRORES)
- 17-18 453,623
- 16-17 414,379
- 15-16 357,968
- 14-15 322,442
- 13-14 280,945
 5 year CAGR 12% y-o-y growth 9%
Deposit franchise delivers yet another strong year
TOTAL ADVANCES (` IN CRORES)
- 17-18 439,650
- 16-17 373,069
- 15-16 338,774
- 14-15 281,083
- 13-14 230,067
5-year CAGR 17% y-o-y growth 18%
Loan growth continues to remain strong
RETAIL ADVANCES (` IN CRORES)
- 17-18 206,465
- 16-17 167,993
- 15-16 138,521
- 14-15 111,932
- 13-14 88,028
5-year CAGR 26% y-o-y growth 23%
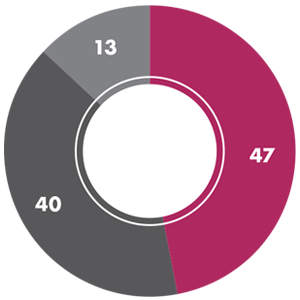
Loan portfolio of the Bank is now dominated by Retail, representing 47% of total advances
CASA (` IN CRORES)
- 17-18 243,852
- 16-17 213,050
- 15-16 169,445
- 14-15 144,400
- 13-14 126,462
5-year CAGR 17% y-o-y growth 14%
Low cost deposits continue to report healthy growth
SAVINGS BANK DEPOSITS (` IN CRORES)
- 17-18 148,202
- 16-17 126,048
- 15-16 105,793
- 14-15 88,292
- 13-14 77,776
5-year CAGR 18% y-o-y growth 18%
Low cost deposits continue to report healthy growth
CURRENT ACCOUNT DEPOSITS (` IN CRORES)
- 17-18 95,650
- 16-17 87,002
- 15-16 63,652
- 14-15 56,108
- 13-14 48,686
5-year CAGR 15% y-o-y growth 10%
Low cost deposits continue to report healthy growth
Low cost deposits continue to report healthy growth
TOTAL ASSETS/LIABILITIES (` IN CRORES)
- 17-18 691,330
- 16-17 601,468
- 15-16 539,821
- 14-15 461,932
- 13-14 383,245
5-year CAGR 15% y-o-y growth 15%
Overall balance sheet growth remains healthy
NET INTEREST INCOME (` IN CRORES)
- 17-18 18,618
- 16-17 18,093
- 15-16 16,833
- 14-15 14,224
- 13-14 11,952
5-year CAGR 14% y-o-y growth 3%
NII grew 3% y-o-y impacted mainly by high slippages
OTHER INCOME (` IN CRORES)
- 17-18 10,967
- 16-17 11,691
- 15-16 9,371
- 14-15 8,365
- 13-14 7,405
5-year CAGR 11% y-o-y growth 6%
Other income declined y-o-y on account of lower trading gains
OPERATING REVENUE (` IN CRORES)
- 17-18 29,585
- 16-17 29,784
- 15-16 26,204
- 14-15 22,589
- 13-14 19,357
5-year CAGR 13% y-o-y growth (1%)
Operating revenue impacted by lower growth in NII and lower trading gains
OPERATING PROFIT (` IN CRORES)
- 17-18 15,594
- 16-17 17,585
- 15-16 16,104
- 14-15 13,385
- 13-14 11,456
5-year CAGR 11% y-o-y growth (11%)
Operating profit declined on account of higher growth in operating expenses compared to growth in operating revenue
NET PROFIT (` IN CRORES)
- 17-18 276
- 16-17 3,679
- 15-16 8,224
- 14-15 7,358
- 13-14 6,218
y-o-y growth 93%
Earnings impacted by provisioning on NPAs
BOOK VALUE PER SHARE*(`)
- 17-18 247.20
- 16-17 232.83
- 15-16 223.12
- 14-15 188.47
- 13-14 162.69
5-year CAGR 12% y-o-y growth 6%
DIVIDEND PER SHARE*(`)
- 17-18 NIL
- 16-17 5.00
- 15-16 5.00
- 14-15 4.60
- 13-14 4.00
GROSS NPA/NET NPA(%)
- 17-18 3.40 6.77
- 16-17 2.11 5.04
- 15-16 0.70 1.67
- 14-15 0.44 1.34
- 13-14 0.40 1.22
NPA  GROSS NPA
*Previous year figures have been adjusted to reflect the effect of sub-division of one equity share of the Bank having nominal value of H10 each into five equity shares of nominal value of `2 each.
LOANS & ADVANCES MIX IN 2017-18(%)

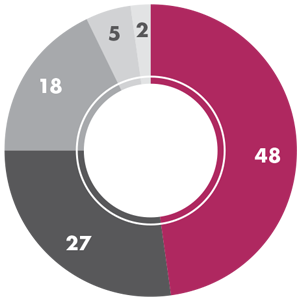
FEE INCOME MIX IN 2017-18(%)

FINANCIAL RATIOS(%)

Previous year figures have been re-grouped wherever necessary. All above figures are standalone.